If I Invested . In
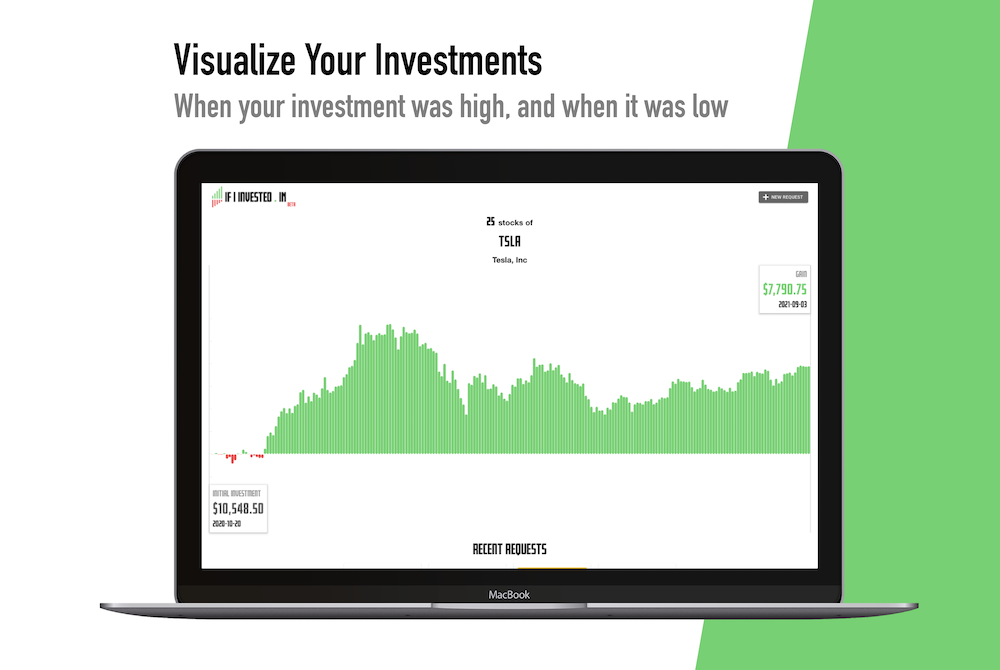
Visualize Your Investments
Or scroll to discover more
What is If I Invested . In?
Here is a high level and deep dive
SHORT ANSWER
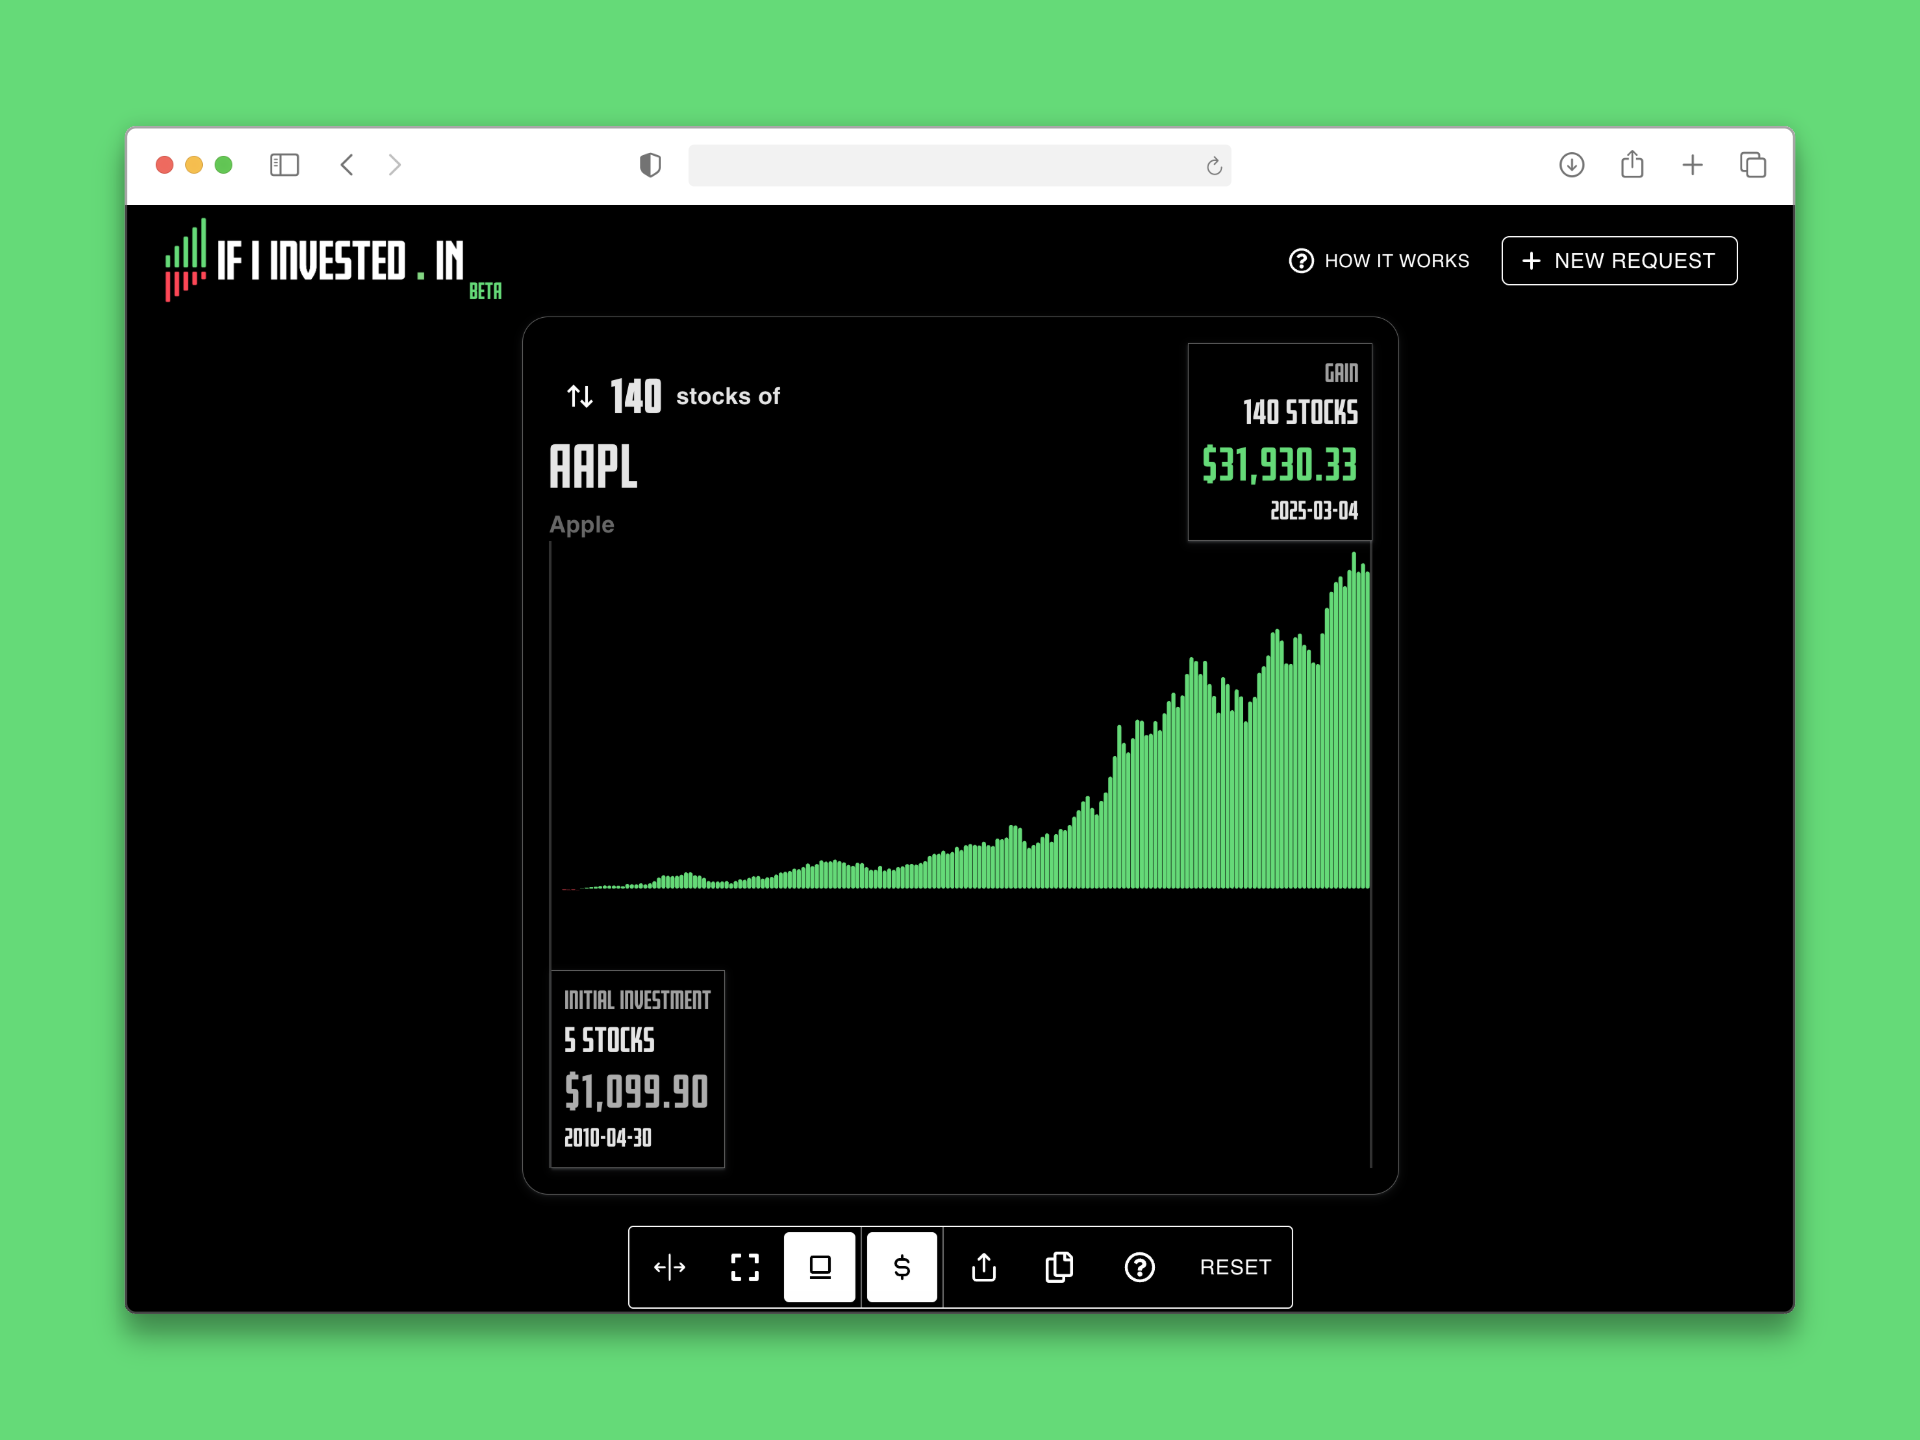
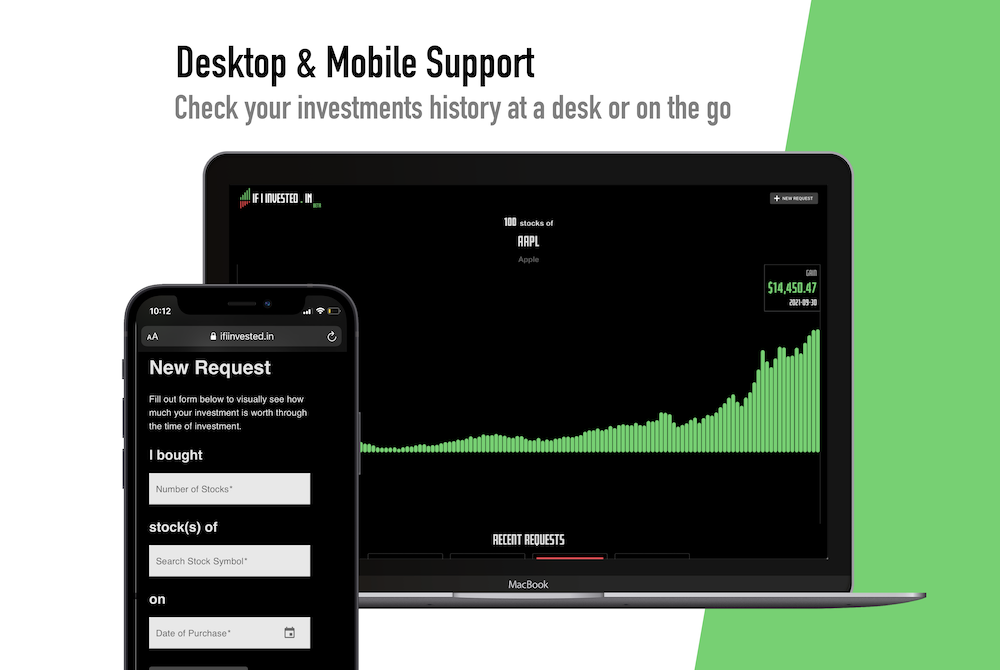
An interactive website to visualize your investments over time
LONG ANSWER
The original idea sparked from a frustration with all these applications that show rolling totals of your investments. Usually if you want to see the true breakdowns of daily or monthly you have to manually compare the number of investments and calculate all the gains and losses.This app simplifies it, you fill in when you had invested in the stock and it gives you a visualizing way to see how your investment has gone over time.
Show More
Features
Key features this app has and you might like
Global Search
Whether your stock is listed on the NYSE, TSX, NASDAQ, or other major markets, you can use our global search to find it by entering either the stock symbol or company name.
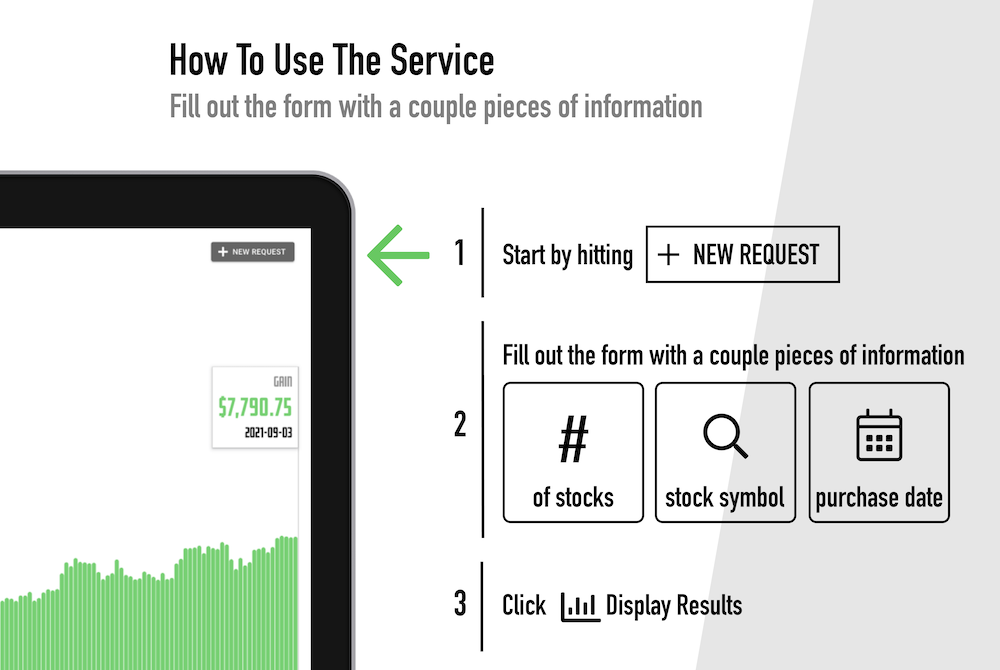
Custom View
After generating a new request, use the toolbar to customize your view. You can create a card summary, hide cost details, and share or copy the request link.
View Hackathon About This
Live Links
Set up customized requests and use the live link in the toolbar to create a custom link. You can revisit it anytime—whether in a week, a month, or a year.
Details
Little data pieces about this project
PLATFORMS
Web
COST
Free (for now)
LAUNCHED
September 13, 2021
4 years ago
Screenshots & Marketing
Here is a high level and deep dive
CONTACT US
Email us here for any issues, reports or maybe just things you would like to see in new versions of If I Invested . In!
HOW TO CONTACT US?
Discover more ideas by us
SOCIAL & LINKS
Follow for updates and cool new things
Product Hunt
Hype Post Articles
Live Link - 34 Stocks of Netflix
Live Link - 1 AAPL Stock